|
 |
Country Profile
Physico-Geographical Conditions for Agriculture
Population. Agricultural Employment
Land Resources and their Use
Material and Technical Base
Agricultural Production
Food Industry
Forestry
Fisheries
Physico-Geographical Conditions for Agriculture:
The Republic of Belarus is situated in the center of Europe and is considered to be one of Eastern European countries. Its area is 207.600 square km. As of January 1, 2011 the agricultural lands occupy the area of 8897,5 thousand hectares. The Republic is rich in forests of total area equal to 9,43 million square km. Approximately 20781 rivers flow through the territory of the Republic, there are 10780 lakes, 1,5 thousand ponds and more than 153 storage reservoirs. Belarus borders on the Russian Federation in the North and East, Ukraine in the South, Poland in the West, Lithuania and Latvia in the North-West. The territory is divided into 6 administrative regions and 118 rural districts. It stretches from West to East for 650 km and from North to South for 560 km. The average altitude above the sea level is 160 meters, the highest point is the Dzerzhinskaya mountain, Dzerzhinsk district, Minsk region (345 meters above the sea level). The country's lowest place is the valley of the Neman river, Grodno region (less than 85 meters above sea level).
The Republic of Belarus is a country with a temperate continental climate, but the prevalence of western and north-western coastal air masses makes the climate transitional from coastal to continental. The average temperature in January, the coldest month, ranges from -4°C in the south-west up to -9°C in the north-east regions; the average temperature in July, the warmest month, varies from +17°C in the north up to +19,5°C in the south. There are considerable variations of the sum of positive temperatures during the period of growth and development of agricultural crops; they range from 2100° up to 2500°C. The period of active vegetation of the cultivated cros varies from 190 up to 205 days. The average annual precipitation in the central and north-eastern parts of the country is 600-650 mm in the south, and 500-600 mm in the south-west. The Republic disposes stocks of peat and potassium fertilizers applied for the increasing of soil fertility.
The agriculture of the Republic is specialized on cultivation of the traditional for the temperate latitudes crops. The following crops prevail in plant growing branch: barley (Hordeum vulgare), rye (Secale cereale), common wheat (Triticum aestivum), potatoes (Solanum tuberosum), and some feed crops. Due to the structural changes and orientation towards the renewable energy sources there is the tendency of expanding the amounts of cultivated grain legumes and oil-yielding crops. Belarus localizes about 16 % of global flax (Linum) sowings, and more than 20% of flax plantings on the European continent.
Animal husbandry specializes on cattle (meat and dairy branch), swine and poultry.
Population. Agricultural Employment:
As of January 1, 2011, the population of the Republic of Belarus is 9463 thousand people. Among them, over 1885,1 thousand resides in Minsk. The average population density in the Republic is 46 people per 1 square kilometer. Population density in Minsk is 6072 people per 1 square kilometer.
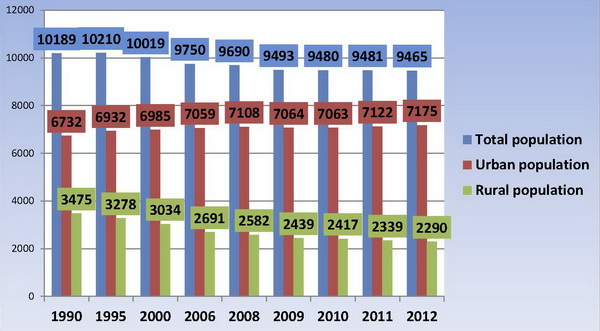
The following demographic processes, typical for the developed industrial countries take place in the Republic: reduction of overall rate of population increment, birth rate fall, increase of elderly persons' number. As of January 1, 2011, more than 75% (7122333 persons) of population live in urban areas and only 25% (2358860 persons) - in rural localities.
Ratio of rural and urban population of Belarus, thousand persons
Labour resources (thous. persons)
|
2000 |
2005 |
2009 |
2010 |
2011
(estimation) |
2012 |
Labour resources - total |
5997 |
6106 |
6082 |
6079 |
6070 |
|
of which: |
|
|
|
|
|
|
able-bodied population at working age |
5503 |
5838 |
5778 |
5742 |
5733 |
|
persons over and under working
age employed in the economy |
345 |
268 |
304 |
337 |
337 |
|
Of total labour resources, economically active population |
4524 |
4491 |
4686 |
4705 |
4664 |
4586 |
of which employed |
4409 |
4414 |
4644 |
4666 |
4632 |
4557 |
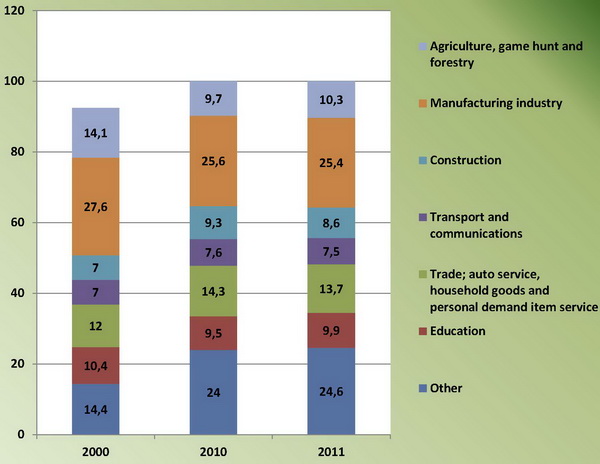
Arrangement of number of employed by branches of the economy (in 2011 - evaluation)
(percent of total number of employed)
Land Resources and their Use:
Land resources include all types of lands: agricultural lands, lands of the populated areas, lands of industrial territories, transport, health resorts, nature reserves, state forest resources. Available land of the Republic of Belarus remains invariable and at the beginning of 2012 composes 207,60 thousand hectares.
Agricultural lands occupy 43% (8897,5 thous. ha) of the total area, arable lands compose 30%, respectively. There are 0,9 hectares of agricultural lands per capita, including 0,6 hectares of arable lands. Unused and little-used lands (sands, bushes, bogs, etc.) compose about 15% of the total area. During the last 20 years 488 thousand hectares dropped out of the agricultural usage.
Distribution of lands according to soil types, %
|
Automorphic |
Semi-automorphic |
Hydromorphic |
|
Rendzina soils |
Sod-podzolic soils |
Sod-podzolic
marshland soils |
Sod and rendzinas
marshland soils |
Flood plain sod soils |
Peat-bog soils |
Brest |
0.4 |
22.6 |
26.3 |
14.3 |
5.9 |
30.5 |
Vitebsk |
0.1 |
43.3 |
29.0 |
10.1 |
2.2 |
15.3 |
Gomel |
0.1 |
33.0 |
29.6 |
7.6 |
10.9 |
18.8 |
Grodno |
0.1 |
59.9 |
15.6 |
10.2 |
4.7 |
9.5 |
Minsk |
0.4 |
48.0 |
21.8 |
7.6 |
2.9 |
19.3 |
Mogilev |
0.2 |
53.8 |
25.0 |
6.3 |
5.8 |
8.9 |
Total |
0.2 |
45.1 |
22.6 |
9.0 |
8.7 |
14.4 |
Distribution of agricultural land by categories of land users
(at the beginning of year; thsd. hectares)
Years |
Total area
of agricultural land |
of which: |
agricultural organizations |
private (peasant) farms |
in individual use |
of which: |
as private subsidiary plots, for
construction
and maintenance
of dwelling houses |
for collective fruit and vegetable gardening, summer house (dacha) construction |
Agricultural land: |
2001 |
9257,7 |
7674,0 |
72,1 |
1396,2 |
975,2 |
76,9 |
2006 |
9011,5 |
7484,7 |
130,5 |
1226,5 |
880,7 |
62,8 |
2007 |
8984,9 |
7526,5 |
120,4 |
1157,6 |
847,2 |
61,4 |
2008 |
8968,0 |
7584,0 |
107,8 |
1080,1 |
791,5 |
59,8 |
2009 |
8944,7 |
7634,8 |
103,0 |
1020,9 |
754,6 |
58,3 |
2010 |
8926,9 |
7657,9 |
108,8 |
968,0 |
728,9 |
56,3 |
2011 |
8997,5 |
7673,4 |
115,8 |
924,3 |
701,1 |
53,1 |
Arable lands: |
2001 |
6133,2 |
5004,2 |
58,1 |
1022,3 |
908,6 |
55,8 |
2006 |
5542,4 |
4513,8 |
92,8 |
880,2 |
813,9 |
44,1 |
2007 |
5539,4 |
4557,3 |
86,1 |
835,7 |
779,9 |
40,7 |
2008 |
5519,4 |
4613,1 |
78,4 |
777,9 |
724,7 |
39,1 |
2009 |
5516,4 |
4651,3 |
77,0 |
742,0 |
691,7 |
37,7 |
2010 |
5516,5 |
4673,7 |
80,7 |
714,1 |
667,8 |
35,8 |
2011 |
5510,5 |
4698,2 |
85,4 |
682,1 |
640,0 |
31,6 |
Lands under permanent agricultural crops: |
2001 |
123,5 |
47,5 |
0,4 |
73,6 |
52,1 |
20,9 |
2006 |
118,1 |
44,3 |
1,2 |
70,5 |
51,6 |
18,6 |
2007 |
121,4 |
44,2 |
1,2 |
73,7 |
52,7 |
20,7 |
2008 |
120,8 |
44,0 |
1,2 |
72,9 |
51,9 |
20,7 |
2009 |
120,8 |
44,8 |
1,2 |
72,4 |
51,4 |
20,6 |
2010 |
120,3 |
44,3 |
1,8 |
71,9 |
51,2 |
20,5 |
2011 |
122,1 |
44,8 |
2,3 |
72,7 |
51,2 |
21,3 |
Meadow lands: |
2001 |
2995,1 |
2616,8 |
13,6 |
300,2 |
14,4 |
0,2 |
2006 |
3289,2 |
2892,3 |
36,1 |
275,7 |
15,1 |
0,1 |
2007 |
3297,6 |
2924,5 |
33,1 |
248,2 |
14,6 |
-- |
2008 |
3275,9 |
2926,7 |
28,2 |
228,4 |
13,8 |
-- |
2009 |
3279,7 |
2938,7 |
24,8 |
206,4 |
11,4 |
-- |
2010 |
3263,1 |
2939,9 |
26,3 |
181,9 |
9,8 |
-- |
2011 |
3240,6 |
2930,4 |
27,6 |
169,4 |
9,8 |
0,2 |
Dynamics of sown area under main agricultural crops in farms of all types
(thsd. hectares)
Years |
Total sown areas |
Cereals and
leguminous crops |
Potatoes |
Vegetables |
Flax |
Sugar beet |
Forage crops |
2004 |
5541 |
2390 |
509 |
94 |
79 |
86 |
2247 |
2005 |
5473 |
2314 |
467 |
89 |
78 |
100 |
2289 |
2006 |
5551 |
2404 |
437 |
95 |
75 |
108 |
2309 |
2007 |
5592 |
2567 |
415 |
90 |
70 |
96 |
2143 |
2008 |
5612 |
2576 |
398 |
89 |
80 |
93 |
2075 |
2009 |
5713 |
2591 |
389 |
86 |
68 |
93 |
2123 |
2010 |
5600 |
2580 |
371 |
86 |
62 |
97 |
2066 |
Sown area under agricultural crops at farms of all types (thsd. hectares)
Farms of all types |
2000 |
2005 |
2007 |
2008 |
2009 |
2010 |
Total grains and legumes |
2537 |
2314 |
2567 |
2576 |
2591 |
2580 |
of which: |
winter grain crops |
1059 |
1085 |
1231 |
1300 |
1302 |
1131 |
of which: |
|
rye |
723 |
537 |
584 |
545 |
454 |
352 |
wheat |
240 |
197 |
247 |
316 |
348 |
362 |
triticale |
96 |
349 |
399 |
436 |
491 |
405 |
barley |
- |
2 |
2 |
3 |
9 |
12 |
spring grains and legumes |
1478 |
1229 |
1336 |
1276 |
1289 |
1449 |
of which: |
wheat |
212 |
164 |
182 |
200 |
214 |
249 |
triticale |
3 |
14 |
18 |
24 |
30 |
39 |
barley |
736 |
613 |
679 |
613 |
602 |
679 |
oat |
285 |
232 |
222 |
182 |
167 |
184 |
grain maize |
13 |
36 |
108 |
114 |
102 |
113 |
buckwheat |
22 |
8 |
10 |
17 |
23 |
31 |
legumes |
198 |
154 |
103 |
113 |
143 |
140 |
other grains |
9 |
8 |
12 |
13 |
8 |
14 |
Industrial crops |
257 |
314 |
377 |
474 |
524 |
497 |
of which: |
fibre flax |
82 |
78 |
70 |
80 |
68 |
62 |
sugar beet |
52 |
100 |
96 |
93 |
93 |
97 |
rape |
110 |
128 |
205 |
293 |
353 |
326 |
Potatoes |
661 |
467 |
415 |
398 |
389 |
371 |
Vegetables |
98 |
89 |
90 |
89 |
86 |
86 |
Forage crops |
2602 |
2289 |
2143 |
2075 |
2123 |
2066 |
of which: |
annual grasses |
654 |
656 |
508 |
415 |
509 |
464 |
perennial grasses |
1394 |
1126 |
955 |
900 |
848 |
869 |
maize for forage and green feed |
435 |
450 |
630 |
714 |
729 |
699 |
forage roots |
105 |
54 |
48 |
43 |
36 |
34 |
Material and Technical Base:
Availability of basic agricultural machinery and equipment in agricultural organisations
(beginning of year; thsd. units)
Type |
2001 |
2006 |
2007 |
2008 |
2009 |
2010 |
2011 |
Tractors (excluding tractors with mounted digging,
land-improving and other machines) |
72,9 |
53,6 |
52,6 |
50,4 |
49,5 |
48,1 |
47,3 |
Lorries |
46,3 |
32,5 |
30,8 |
28,4 |
27,0 |
26,3 |
25,1 |
Harvesters: |
-grain |
17,1 |
12,8 |
13,3 |
13,0 |
12,9 |
12,2 |
11,4 |
-potato |
3,8 |
1,6 |
1,5 |
1,3 |
1,2 |
1,1 |
1,2 |
-beet, units. |
758 |
987 |
1033 |
1021 |
989 |
877 |
798 |
-silage and fodder |
7,2 |
3,2 |
2,5 |
2,0 |
2,0 |
3,2 |
2,6 |
-maize |
87 |
49 |
44 |
39 |
39 |
35 |
34 |
-flax |
1,8 |
1,3 |
1,3 |
1,1 |
1,1 |
1,0 |
0,9 |
Ploughs |
20,5 |
15,0 |
15,1 |
14,8 |
14,0 |
13,5 |
13,1 |
Sowing machines (excluding fertilizer sowers) |
17,6 |
12,6 |
12,7 |
11,7 |
10,7 |
9,7 |
9,0 |
Cultivators |
26,1 |
14,6 |
13,7 |
12,4 |
11,1 |
10,0 |
9,3 |
Mowing machines, tractor-mounted |
15,2 |
10,0 |
9,8 |
9,4 |
9,4 |
9,0 |
8,8 |
Balers |
7,4 |
6,3 |
6,4 |
6,4 |
6,7 |
6,8 |
7,0 |
Reapers |
1,6 |
1,2 |
1,2 |
1,1 |
1,1 |
1,0 |
1,0 |
Sprinkling and watering machines and installations, units |
362 |
170 |
209 |
229 |
244 |
244 |
249 |
Machinery for fertilizer application for: |
-solid organic fertilizers |
12,4 |
7,6 |
7 ,1 |
6,7 |
6,8 |
6,6 |
6,6 |
-liquid organic fertilizers |
3,8 |
2,7 |
2,6 |
2,7 |
2,8 |
2,9 |
3,1 |
Solid mineral fertilizer spreaders |
8,6 |
6,7 |
7,0 |
6,9 |
7,0 |
7,1 |
7,1 |
Tractor-mounted spraying and dusting machines |
4,5 |
4,4 |
4,5 |
4,7 |
5,0 |
5,0 |
5,0 |
Milking machines |
14,8 |
12,8 |
12,7 |
12,8 |
13,3 |
13,5 |
13,4 |
Agricultural Production:
Agriculture is the basic complexing branch of agroindustrial complex. Agricultural production in the second quarter of 2011 made up 4,1% of the gross domestic product of the country. Agricultural production is represented by two main industries: plant growing and animal husbandry.
As of the beginning of 2010 in the Republic there are 1305 agricultural organizations and enterprises, 2016 peasant and farm holdings, 1100 thous. personal subsidiary plots. Employment in agricultural production is represented by 438,4 thous. persons (9,5 % of economically active population). Agriculture is generally aimed at satisfaction of home market requirements in foodstuffs. Particular kinds of foodstuffs proved to be perspective export potential.
Taking into consideration the specialization of agricultural branch on dairy and meat animal husbandry the main ratio in plant growing branch is given to cereals, leguminous and forage crops. Barley, rye, oat and triticale are the prevailing cereals. Special emphasis is given to potato and flax. Carrot, sugarbeet and cabbage are the main vegetable cultures.
Agricultural Output by Type of Farms
(at current prices; bln. rubles)
* - at factual prices; bln. rubles
|
2000 |
2005 |
2006 |
2007 |
2008 |
2009 |
2010 |
2011 |
Farms of all types |
Total agricultural output |
2734 |
12826 |
15544 |
18102 |
25052 |
26595 |
35613 |
56741 |
of which: |
plant-growing products |
1475 |
6700 |
8346 |
9739 |
13772 |
14056 |
19644 |
30402 |
animal husbandry products |
1259 |
6126 |
7198 |
8363 |
11280 |
12539 |
15969 |
26339 |
Agricultural organisations |
Total agricultural output |
1673 |
7914 |
9633 |
11696 |
16958 |
18495 |
22960 |
|
of which: |
plant-growing products |
751 |
3112 |
3773 |
4748 |
7431 |
7739 |
8999 |
|
animal husbandry products |
922 |
4802 |
5860 |
6948 |
9527 |
10756 |
13961 |
|
Household plots |
Total agricultural output |
1044 |
4819 |
5795 |
6269 |
7878 |
7874 |
12286 |
|
of which: |
plant-growing products |
709 |
3520 |
4483 |
4881 |
6160 |
6134 |
10331 |
|
animal husbandry products |
335 |
1299 |
1312 |
1388 |
1718 |
1740 |
1955 |
|
Private (peasant) farms |
Total agricultural output |
17 |
93 |
116 |
137 |
216 |
226 |
367 |
|
of which: |
plant-growing products |
15 |
68 |
90 |
110 |
181 |
183 |
314 |
|
animal husbandry products |
2 |
25 |
26 |
27 |
35 |
43 |
53 |
|
Gross harvest of major agricultural crops
(in farms of all types; thousand tonnes)
|
1995 |
2000 |
2001 |
2002 |
2003 |
2004 |
2005 |
2006 |
2007 |
2008 |
2009 |
2010 |
Cereal and leguminous crops
(weight after treatment): |
5502 |
4856 |
5153 |
5990 |
5449 |
7016 |
6421 |
5923 |
7216 |
9013 |
8510 |
6993 |
of which: |
|
|
|
|
|
|
|
|
|
|
|
|
rye |
2143 |
1360 |
1294 |
1600 |
1152 |
1397 |
1155 |
1072 |
1305 |
1492 |
1227 |
736 |
wheat |
439 |
966 |
867 |
1017 |
796 |
1121 |
1175 |
1075 |
1397 |
2045 |
1979 |
1740 |
triticale |
113 |
311 |
427 |
798 |
890 |
1216 |
1121 |
978 |
1241 |
1819 |
1789 |
1254 |
barley |
1965 |
1378 |
1700 |
1681 |
1608 |
2031 |
1864 |
1831 |
1911 |
2221 |
2123 |
1966 |
oat |
638 |
495 |
530 |
575 |
594 |
765 |
609 |
555 |
580 |
605 |
552 |
442 |
leguminous crops
|
187 |
291 |
281 |
279 |
333 |
426 |
331 |
238 |
202 |
301 |
357 |
265 |
buckwheat |
14 |
18 |
16 |
7 |
12 |
12 |
7 |
5 |
13 |
18 |
19 |
19 |
grain maize |
3 |
30 |
31 |
30 |
50 |
39 |
144 |
153 |
541 |
495 |
449 |
551 |
Flax fibre |
60 |
37 |
32 |
26 |
41 |
57 |
50 |
29 |
39 |
61 |
47 |
46 |
Sugar beet |
1172 |
1474 |
1682 |
1146 |
1920 |
3088 |
3065 |
3978 |
3626 |
4030 |
3970 |
3770 |
Rape |
26 |
73 |
95 |
60 |
55 |
143 |
150 |
115 |
240 |
514 |
612 |
374 |
Potatoes |
9504 |
8718 |
7768 |
7421 |
8649 |
9902 |
8185 |
8329 |
8744 |
8749 |
7125 |
7831 |
Vegetables |
1031 |
1379 |
1415 |
1507 |
2002 |
2035 |
2007 |
2173 |
2153 |
2296 |
2308 |
2334 |
Yielding capacity of the main agricultural crops
(farms of all types, centners per hectare)
|
1995 |
2000 |
2001 |
2002 |
2003 |
2004 |
2005 |
2006 |
2007 |
2008 |
2009 |
2010 |
Cereal and leguminous crops
(weight after processing): |
21,2 |
19,4 |
19,9 |
24,7 |
24,2 |
29,6 |
28,1 |
24,9 |
28,5 |
35,2 |
33,3 |
27,7 |
of which: |
|
|
|
|
|
|
|
|
|
|
|
|
rye |
22,4 |
19,0 |
16,8 |
22,8 |
21,1 |
23,6 |
21,8 |
22,0 |
22,7 |
27,5 |
27,4 |
21,5 |
wheat |
25,1 |
21,6 |
21,4 |
27,1 |
25,1 |
33,0 |
32,8 |
28,2 |
32,8 |
39,8 |
35,4 |
28,9 |
triticale |
29,9 |
31,6 |
28,1 |
31,9 |
26,6 |
34,1 |
31,3 |
26,0 |
30,2 |
39,7 |
34,6 |
28,8 |
barley |
20,0 |
19,0 |
22,7 |
25,3 |
25,5 |
32,7 |
30,7 |
26,9 |
28,5 |
36,1 |
35,2 |
28,9 |
oat |
19,8 |
17,7 |
18,4 |
22,4 |
25,3 |
28,8 |
26,6 |
22,9 |
26,8 |
33,5 |
33,5 |
24,7 |
buckwheat |
8,1 |
8,7 |
6,3 |
6,4 |
10,5 |
10,3 |
10,2 |
6,5 |
11,3 |
11,6 |
9,4 |
7,3 |
grain maize |
27,0 |
23,3 |
27,7 |
40,0 |
43,4 |
35,3 |
40,0 |
39,4 |
50,7 |
43,9 |
46,8 |
49,3 |
leguminous crops |
16,4 |
15,1 |
15,4 |
18,5 |
21,2 |
25,4 |
21,9 |
15,7 |
20,7 |
27,1 |
25,8 |
20,3 |
Flax fibre |
6,2 |
4,8 |
4,2 |
4,4 |
6,1 |
7,3 |
7,0 |
4,4 |
5,9 |
7,8 |
7,2 |
7,7 |
Sugar beet |
218 |
292 |
313 |
228 |
275 |
368 |
316 |
376 |
387 |
439 |
450 |
395 |
Rape |
6,5 |
7,1 |
8,8 |
8,2 |
9,0 |
11,7 |
12,3 |
10,7 |
12,2 |
18,1 |
18,0 |
12,2 |
Potatoes |
132 |
134 |
123 |
137 |
164 |
195 |
177 |
192 |
212 |
221 |
186 |
214 |
Vegetables |
135 |
134 |
141 |
157 |
189 |
203 |
208 |
212 |
220 |
234 |
242 |
247 |
Number of livestock and poultry
(farms of all types, as of 1 January; thous. heads)
Years |
Cattle – total |
Cows |
Pigs |
Sheep and goats |
Horses |
Poultry, mln.heads |
2004 |
3924 |
1658 |
3287 |
126 |
192 |
24,5 |
2005 |
3963 |
1613 |
3407 |
125 |
181 |
25,1 |
2006 |
3980 |
1565 |
3545 |
121 |
168 |
28,5 |
2007 |
3989 |
1506 |
3642 |
122 |
156 |
28,7 |
2008 |
4007 |
1459 |
3598 |
124 |
147 |
29,4 |
2009 |
4131 |
1452 |
3705 |
126 |
137 |
31,2 |
2010 |
4151 |
1445 |
3782 |
127 |
125 |
34,1 |
2011 |
4151 |
1478 |
3887 |
124 |
113 |
37 |
Exports of foodstuffs of the Republic of Belarus
(thous. tonnes)
Item/Years |
2004 |
2005 |
2006 |
2007 |
2008 |
2009 |
Beef |
43,5 |
46,6 |
58,4 |
41,8 |
34,5 |
60,4 |
Pork |
14,7 |
23,4 |
36,8 |
14,9 |
31,3 |
17,1 |
Poultry meat |
13,2 |
10,5 |
9,0 |
7,9 |
6,2 |
20,9 |
Milk and concentrated cream |
94,3 |
119,0 |
153,0 |
161,0 |
167,9 |
185,2 |
Sweet butter |
46,8 |
51,3 |
53,6 |
49,5 |
61,5 |
85,5 |
Cheese and curd cheese |
53,5 |
65,1 |
82,6 |
99,0 |
102,0 |
121,4 |
Eggs, mln. pcs |
531,0 |
441,8 |
515,9 |
437,9 |
463,5 |
522,8 |
Sugar |
383,9 |
481,6 |
250,5 |
272,1 |
323,5 |
439,9 |
Confectionery |
25,8 |
21,1 |
18,1 |
12,4 |
9,0 |
9,5 |
Potatoes |
103,0 |
16,9 |
9,9 |
31,1 |
41,9 |
28,2 |
Food Industry:
Food industry includes 20 branches. Altogether there are 2730 enterprises which produce food products, alcoholic and soft drinks, tobacco goods and also perfumes and cosmetics.Enterprises of the Ministry of Agriculture and Food of the Republic of Belarus produce more than 70% of the Republic's output, enterprises of Belarusian State Concern of Food Industry "Belgospishcheprom" - about 20%, and only 10 % of the total volume of agricultural production is produced by foreign and joint companies and enterprises of "Belkoopsoyuz".
In the structure of food industry the leading place belongs to meat and dairy branches (28.9% and 24.8% respectively). Significant specific density in the structure of food industry belongs to baking (8,0%), sugar (8,2%), confectionary (4,6%), winemaking (3,6%) and fishery (4,2%) industries. Production of the main foodstuff commodities
Type of products |
2004 |
2005 |
2006 |
2007 |
2008 |
2009 |
2010 |
Meat including
offal of 1 rate, thou. ton |
406,7 |
470,0 |
542,1 |
580,8 |
619,9 |
696,9 |
743,5 |
Sausages, thous. tons |
220,0 |
256,5 |
278,0 |
273,4 |
306,5 |
295,1 |
313,8 |
Animal butter, thous. tons |
81,6 |
85,0 |
109,8 |
121,8 |
140,3 |
140,0 |
|
Fat cheese, including
sheep cheese, thous. tons |
65,1 |
82,3 |
101,0 |
109,9 |
127,9 |
133,9 |
146,2 |
Whole milk products
in milk equivalent, thous. tons |
992 |
1122 |
1284 |
1379 |
1370 |
1315 |
|
Vegetable oils |
27,8 |
42,2 |
43,8 |
49,1 |
82,4 |
139,1 |
|
Granulated sugar – thous. tons |
768,4 |
864,2 |
814,1 |
656,6 |
707,8 |
759,4 |
816,0 |
Preserved foods - total, mln of standard cans |
438 |
436 |
535 |
547 |
658 |
672 |
|
Bread and bakery products, thou. ton. |
691 |
661 |
639 |
617 |
610 |
595 |
568 |
Soft drinks, mln. dal. |
25,3 |
29,2 |
33,8 |
36,4 |
35,4 |
32,2 |
38,6 |
Mineral water, mln. half litres |
352,2 |
367,1 |
387,1 |
402,9 |
383,3 |
349,6 |
|
Consumption of main foodstuff commodities per capita, kg.
Type of products |
2004 |
2005 |
2006 |
2007 |
2008 |
2009 |
Meat and meat products |
59 |
61 |
67 |
70 |
75 |
77 |
Milk and dairy products |
246 |
259 |
254 |
250 |
233 |
224 |
Eggs, pcs. |
238 |
256 |
276 |
275 |
279 |
284 |
Fish and fish products |
17,6 |
18,4 |
17,4 |
17,5 |
15,9 |
15,2 |
Potatoes |
185 |
181 |
187 |
188 |
189 |
181 |
Bakery products |
100 |
95 |
93 |
92 |
89 |
86 |
Sugar |
39,4 |
38,7 |
36,1 |
34,2 |
39,1 |
40 |
Vegetable oil |
14,3 |
14,5 |
14,1 |
15,7 |
15,1 |
14,6 |
Vegetables and cucurbits crop |
118 |
127 |
134 |
138 |
143 |
146 |
Fruit and berries |
46 |
47 |
59 |
58 |
59 |
60 |
Forestry:
The Republic of Belarus possesses substantial forest resources. The total area of forest is about 38% of the country territory. Total area of the forest fund in Belarus is 9.4 million ha, including 8.04 million ha under the jurisdiction of the Ministry of Forestry. As a result of the planned regulation of the felling volumes, first of all of major fellings, the total stock of forest stands increased by a factor of 1.6 and made according to information of 01.01.2010 more than 197 mln. cubic meter.
As a result of the economic activity and of the natural processes of forest growing the forest productivity raised appreciably: average stock of growing wood per 1 ha of forest increased in a given time by from 135 to 196 m3, including the mature and overmature forest stands from 216 to 244 m3. The average age of the forest stands increased by 12 years and amounted 51 year. According to particular indexes, characterizing forest raw material resources, Belarus proved to be one of the forestry leading European countries.
The forest coverage of the territory of the republic has risen from 33.9% to 38.3%. Over 2006-2010 the areas covered with forests increased on 112 thous. ha.
The area of specially protected territories and plots makes nearby 2.3 million ha or 24.2% of the total forest fund area. All forests in Belarus are in exclusive ownership of the state.
Structure of forest stands reserves according to the predominant species, % 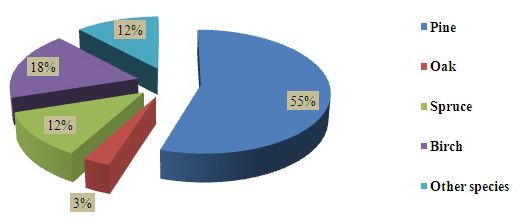
Dynamics of realization of main types of activities in the forestry branch
Indexes |
2005 |
2006 |
2007 |
2008 |
2009 |
Reforestation and forest planting,
total haincluding:
|
51471 |
56217 |
54988 |
50006 |
40760 |
- forest planting and establishment |
45031 |
48662 |
48069 |
43135 |
34320 |
- assistance to natural reforestation |
6440 |
7555 |
6919 |
6871 |
6440 |
Planted seedlings, ha:
- at logged areas
|
23992 |
23841 |
21767 |
20671 |
|
- at lands contaminated with radionuclids (cesium-137) |
11461 |
12808 |
12321 |
9817 |
|
Forest protection against pests and the diseases
- by biological method, ha
|
21622 |
22339 |
22726 |
22623 |
22644 |
- by chemical method, ha |
9533 |
693 |
194 |
2423 |
703 |
Deforestation areas, ha:
- all types of deforestation |
440951 |
452131 |
51991 |
487962 |
|
- deforestation of final cutting |
25124 |
25330 |
0 |
24413 |
|
- fellings for primary use |
223924 |
242266 |
28517 |
256518 |
|
- other types of fellings |
189536 |
182143 |
24816 |
201797 |
|
The main indexes of hunting industry management*
|
1995 |
2000 |
2001 |
2002 |
2003 |
2004 |
2005 |
2006 |
2007 |
2008 |
2009 |
Number of hunting entities (as of the end of a year), pcs. |
216 |
232 |
239 |
238 |
238 |
252 |
249 |
254 |
251 |
252 |
255 |
Area of hunting entities (as of the end of a year), mln. ha |
17,2 |
16,9 |
17,1 |
17,1 |
17,6 |
17,2 |
16,8 |
16,7 |
16,5 |
16,5 |
16,8 |
Expenses for biotechnic measures on protection and reproduction of wild animals (in actual exicting prices), mln. BYR |
1955,6 |
184,9** |
350,7 |
423,6 |
672,6 |
897,9 |
1207,8 |
1925,1 |
3091,0 |
3875,8 |
4957,8 |
of which: |
|
|
|
|
|
|
|
|
|
|
|
for displacement (stocking) of wild animals |
139,8 |
- |
0,4 |
- |
20,3 |
5,7 |
5,1 |
267,0 |
246,4 |
100,2 |
9,7 |
for acquisition and spreading of supplementary feeding for wild animals |
717,3 |
49,4 |
135,2 |
165,8 |
340,6 |
417,9 |
584,1 |
1276,7 |
2431,6 |
2919,2 |
4192,5 |
Expences for realization of census of wild animals (in actual exsisting prices), mln. BYR |
x |
x |
x |
x |
x |
x |
x |
16,2 |
22,4 |
61,7 |
39,1 |
* Without taking into consideration the biological (hunting) nature reserves and restricted zones for hunting.
** Taking into consideration the denomination in 2000 (decreasing in 1000 times).
Forest husbandry branch disposes in its structure the forest hunting branch and supplementary forest management. In such extensive meaning the forest husbandry branch is a forestry-based complex. Forest hunting management is a branch of natural resource use concerned with use of biomass of wild animals, fur-producing animals and birds - hunting objects. The following animals are the hunting objects in Belarus: wild boars, roedeers, elks, hares, foxes, wolves, martens, as well as game birds: ducks, partridges, hazel grouses, black grouses). Development of forest products and services export by institutes and enterprises of the forest branch shows the stable dynamics of growth.
Introduction of new rates of export customs duties for forest products and wood products taking into consideration the degree of processing made the conditions for the positive cjanges in export structure. There was the increasing of volumes of products with high added value, developed the production of new types of products with high added value (wood pellets).
In 2009 national forest products were exported into 24 foreign and CIS countries. The highest demand for forest products was in Poland (43,8% out of total export volume), Germany (11,9%), Lithuania (11,5%), Latvia (8,9%), Belgium (5,7%), Russia - (4,5%), and Sweden (3,8%).
All in all in course of 2009 the export of forest products and services made it possible to obtain USD 57,9 mln, of which - USD 56,5 mln. - forest products, and USD 1,4 mln - forest services.
Fisheries:
The territory of Belarus is watershed for the ponds of Baltic and Black seas. Altogether there are 20800 rivers with the total length of 90600 km. The largest river with the length of more than 500 km is Dnepr with its tributaries Pripet, Berezina, Sozh and Neman. In Belarus there are 10800 lakes and more than 9000 bogs. The largest lake Naroch occupies the area of approximately 80 km2. There were also created 136 man-made reservoirs, the largest of which is Vilejskoye. The total area of reservoirs is approximately 80,0 thou. ha.
Commercial fishery in the national reservoirs is one of the management directions of fisheries in Belarus, which is concerned with fish catching. Commercial fishery in the majority of cases is concentrated in the southern regions, in rivers Dnepr, Pripyat, Sozh, Berezina with their tributaries. Trade value of Neman is substantially lower. Zapadnaya Dvina is not practically used for the commercial fishery.
In reservoirs and rivers of Belarus there are about 56 fish species. At present approximately 20 fish species have the specific trade value. The analysis of the statistical data of commercial fishery in lakes, rivers and reservoirs over the last five years showed that catches of roach, bream and crucian form about 75% of total catches. Whitefishes form approximately 0,2% of total catches, blackhead - 1,9 %, large predators (pike, somata, pike-perch, zherekh) - 4,4 %.
With the adoption of law about the lease, it became possible to pass over the fishing areas to the numerous leaseholders from the number of state and non-governmental enterprises and individuals. This caused the increase of the number of reservoirs used for the commercial fishing. At present 281 leaseholders (including state fish industries) exploit approximately 600 lakes and reservoirs with total area of 1,2 thou. km2 and 2,1 thou. km of rivers length for the commercial fishing. Distribution of fishery reservoirs according to the types
Region |
Type of reservoir |
Total |
Lakes |
Storage ponds |
Ponds |
Borrow area |
quantity |
area, ha |
quantity |
area, ha |
quantity |
area, ha |
quantity |
area, ha |
quantity |
area, ha |
Brest |
188 |
10547,1 |
58 |
11705,6 |
129 |
1947,1 |
11 |
577,3 |
386 |
24777,1 |
Vitebsk |
1787 |
94364,49 |
38* |
1053,5 |
75 |
636,8 |
2 |
20,6 |
1902 |
96075,39 |
Gomel |
819 |
11144,9 |
26 |
4474,9 |
12 |
323,6 |
1 |
1860 |
858 |
17803,4 |
Grodno |
82 |
3044,8 |
28 |
2760 |
89 |
1921,1 |
2 |
193 |
201 |
7918,9 |
Minsk |
200 |
20403,47 |
56 |
21816,2 |
68 |
2061,6 |
4 |
640 |
328 |
44921,27 |
Mogilev |
142 |
1732,5 |
41+1 |
6259,1+120 |
53 |
1373 |
- |
- |
237 |
9484,6 |
Total |
3218 |
141237,26 |
248 |
48189,3 |
426* |
8263,2 |
20* |
3290,9 |
3912 |
200980,66 |
* - precise quantity was not established
Distribution of fishery reservoirs according to the classified groups
|
Classified groups of reservoirs (ponds) |
|
Region |
cisco (Coregonidae) and smelt (Osmerus eperlanu) |
bream (Abramis brama) and pike perch (Stizostedion) |
bream (Abramis brama), pike (Esox lucius), and roach (Rutilus rutilus) |
perch (Perca fluviatilis) and roach (Rutilus rutilus) |
crucian carp (Carassius carassius) and tench (Tinca tinca) |
Total |
|
q-ty |
area, ha |
q-ty |
area, ha |
q-ty |
area, ha |
q-ty |
area, ha |
q-ty |
area, ha |
q-ty |
area, ha |
Brest |
- |
- |
- |
- |
16 |
6951 |
164 |
7780,7 |
206 |
10045,4 |
386 |
24777,1 |
Vitebsk |
21 |
8503,9 |
37 |
26793,5 |
293 |
34421,9 |
904 |
17018,32 |
647 |
9337,77 |
1902* |
96075,39 |
Gomel |
- |
- |
- |
- |
13 |
1882 |
208 |
4586,1 |
637 |
11335,3 |
858 |
17803,4 |
Grodno |
- |
- |
- |
- |
16 |
3563 |
80 |
2740,9 |
105 |
1615 |
201* |
7918,9 |
Minsk |
1 |
7913 |
3 |
10479 |
17 |
16927 |
141 |
4702,4 |
166 |
4899,87 |
328* |
44921,27 |
Mogilev |
- |
- |
- |
- |
1 |
2340 |
72 |
3622,1 |
164 |
3522,5 |
237 |
9484,6 |
Total |
22 |
16416,9 |
40 |
37272,5 |
356 |
66084,9 |
1569 |
40450,52 |
1925 |
40755,84 |
3912 |
200980,66 |
* - precise quantity was not established
The commercial stock of ichthyofauna according to the classified groups of ponds
Region |
Classified groups of reservoirs |
Total |
cisco (Coregonidae) and smelt (Osmerus eperlanu) |
bream (Abramis brama) and pike perch (Stizostedion) |
bream (Abramis brama), pike (Esox lucius), and roach (Rutilus rutilus)
|
perch (Perca fluviatilis) and roach (Rutilus rutilus)
|
crucian carp (Carassius carassius) and tench (Tinca tinca)
|
kg/ha |
tons |
kg/ha |
tons |
kg/ha |
tons |
kg/ha |
tons |
kg/ha |
tons |
|
Brest |
- |
- |
- |
- |
70,0 |
487 |
77,1 |
600 |
41,3 |
415 |
1502 |
Vitebsk |
57,5 |
489 |
72,8 |
1951 |
65,2 |
2244 |
45,4 |
773 |
53,0 |
495 |
5952 |
Gomel |
- |
- |
- |
- |
89,7 |
169 |
81,4 |
373 |
45,7 |
518 |
1060 |
Grodno |
- |
- |
- |
- |
81,0 |
289 |
62,0 |
170 |
33,0 |
53 |
512 |
Minsk |
81,8 |
647 |
80,0 |
838 |
81,9 |
1386 |
55,4 |
261 |
44,4 |
218 |
3350 |
Mogilev |
- |
- |
- |
- |
59,6 |
139 |
64,3 |
233 |
78,7 |
277 |
649 |
Total |
|
1136 |
|
2789 |
|
4714 |
|
2410 |
|
1976 |
13025 |
The river extension and value of commercial stock of ichthyofauna according to the watercourse categories
River category |
Width of the river bed, m variation/average |
Average area of a reach with 1 km stretch, ha |
Total extension within the bounds of Belarus, thous. km |
Usable stock |
kg/ha |
kg/km |
tons |
I |
80-800 (100) |
10 |
3,09 |
81,6 |
816,0 |
2070 |
II |
40 -100 (50) |
5 |
2,47 |
67,2 |
336,0 |
600 |
III |
5 - 40 (20) |
2 |
18,80 |
51,1 |
102,2 |
1280 |
Total |
x |
x |
x |
x |
|
3950* |
* Exclusively of rivers less than 25 km stretch
|